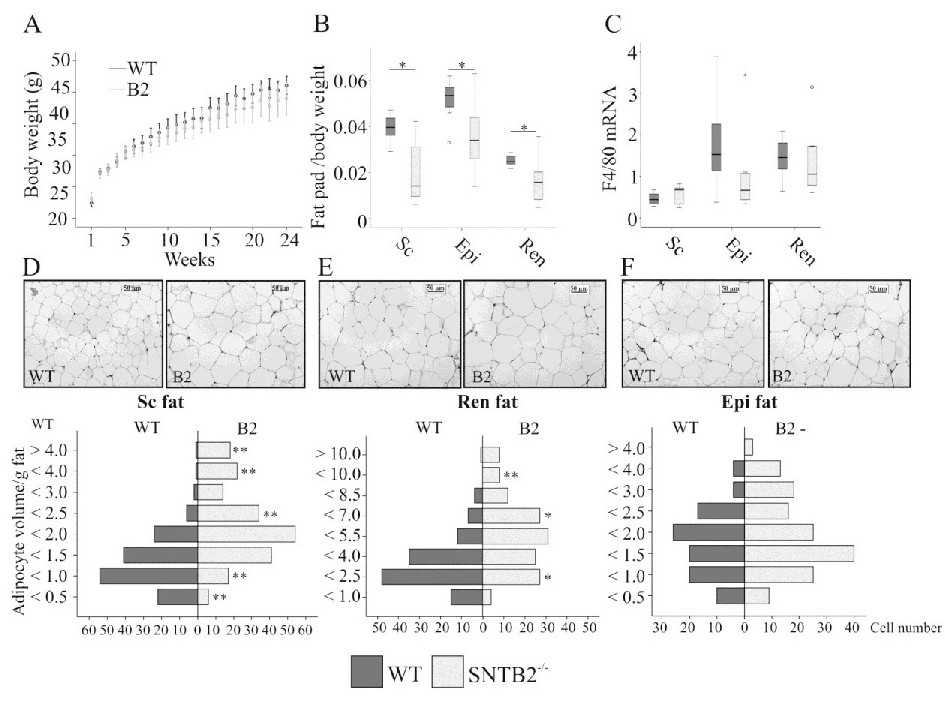
Fig. 1. Adipocyte hypertrophy and reduced fat pad weights in SNTB2-/- mice. A. Body weight of 8 wild type (WT) and 7 SNTB2-/- (B2) mice during 24 weeks high fat diet, data are shown as mean ± SEM. B. Fat pad weight / body weight of wild type and SNTB2-/- mice after 24 weeks high fat diet. C. F4/80 mRNA in the different fat pads of wild type and SNTB2-/- mice. D. H&E-stained tissue sections of subcutaneous adipose tissues. Subcutaneous adipocyte volumes are given below. The volumes were normalized to the weight of this adipose tissue (g) of WT and SNTB2-/- mice. E. H&E-stained tissue sections of perirenal adipose tissue. Perirenal adipocyte volumes are given below. The volumes were normalized to the weight of perirenal adipose tissue (g) of WT and SNTB2-/-. F. H&E-stained tissue sections of epididymal adipose tissue. Epididymal adipocyte volumes are given below. The volumes were normalized to the weight of epididymal adipose tissue (g) of WT and SNTB2-/- mice. Subcutaneous, sc; epididymal, epi; perirenal, ren, * p<0.05, ** p<0.01.